Components / Developer tools
Uptime bars
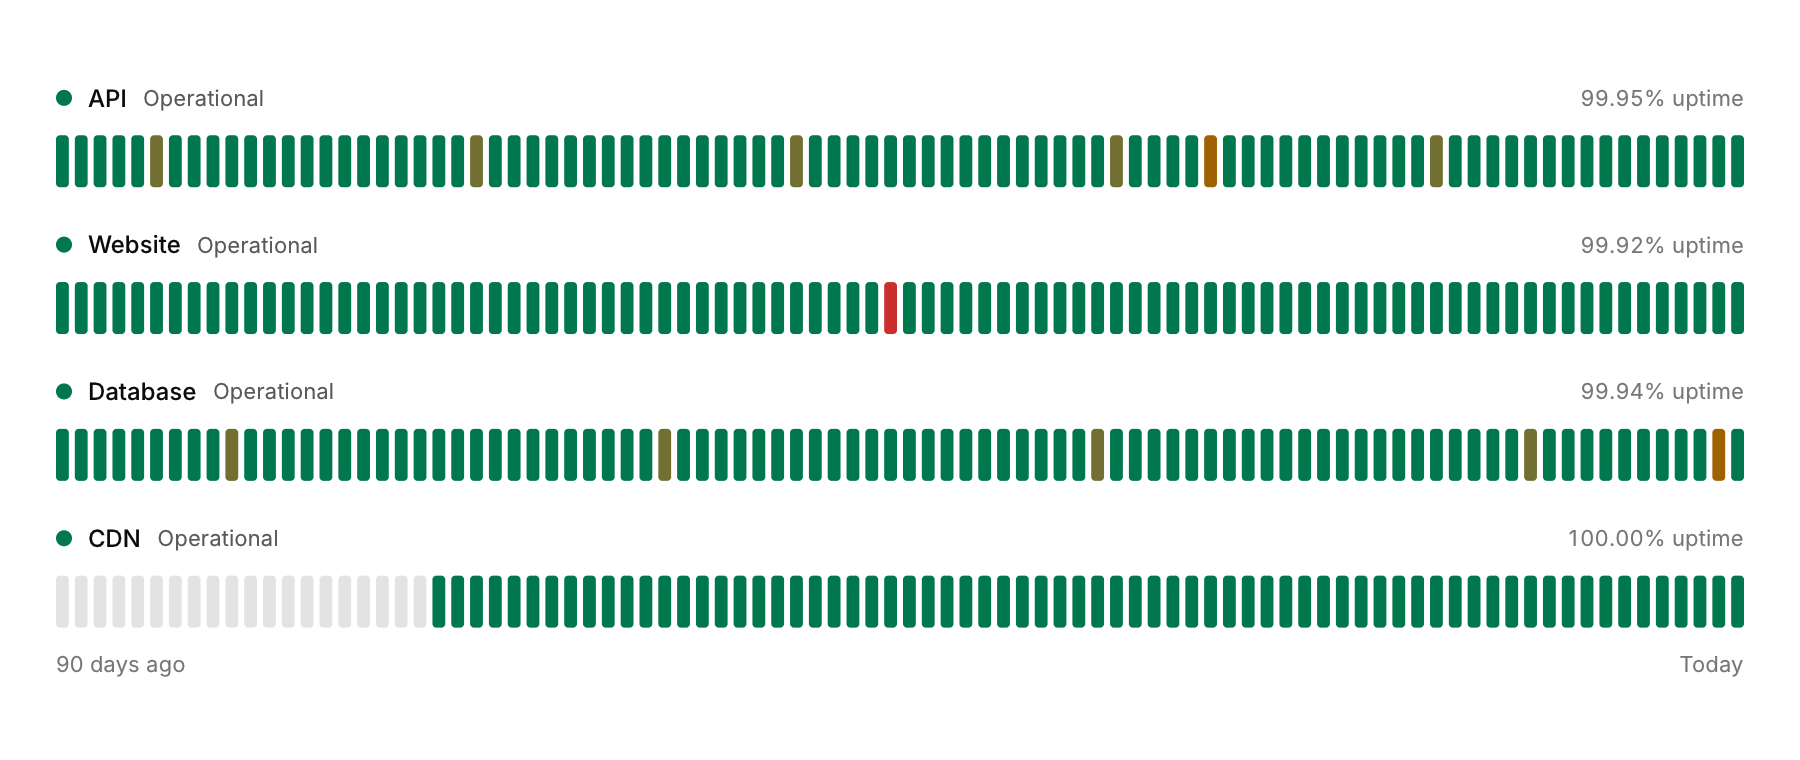
A status page: each service's current state and a bar for each day of its history.
Functions: cui_uptime
Usage
static float api_days[90];   /* the fraction of each day the API was up, oldest first; negative: no data */
const cui_uptime_service services[] = { { "API", api_days, 90 }, { "Website", web_days, 90 } };
cui_uptime(ui, "status", services, 2, .last_day = today);
Each service shows its state from its last day (operational, degraded or outage) and its uptime over the days with data. Below it is one bar per day, colored by availability: green from 99.9%, olive from 99%, amber from 95%, red below that, and gray without data. A hover lifts the bar and shows its date and uptime, and the result names the service and day under the pointer. On a narrow panel only the most recent days that fit are shown, newest on the right.
Options of cui_uptime
| Option | Type | Default | Description |
|---|---|---|---|
.width | cui_size | Width: CUI_FILL, CUI_FIT, CUI_PX(n) or CUI_PCT(n); unset uses the component's own. | |
.last_day | cui_date | the date of the last value, for the tooltips |
cui_uptime_service
| Field | Type | Description |
|---|---|---|
name | const char * | shown above the service's bars |
days | const float * | oldest first: the fraction of the day it was up, 0..1; negative: no data |
day_count | int | number of values in days |
cui_uptime_result
| Field | Type | Description |
|---|---|---|
service | int | under the pointer, or -1 |
day | int | under the pointer, or -1 |
Related
- Time histogram: Event counts over time, stacked by series, as above a log search, with a legend that shows each series' total.
- HTTP request bar: The method, the URL and Send, as in an API client.
- Coverage: Test coverage as a tree built from the files' paths.
- Stack trace: An exception with its call stack.