Components / Developer tools
Coverage
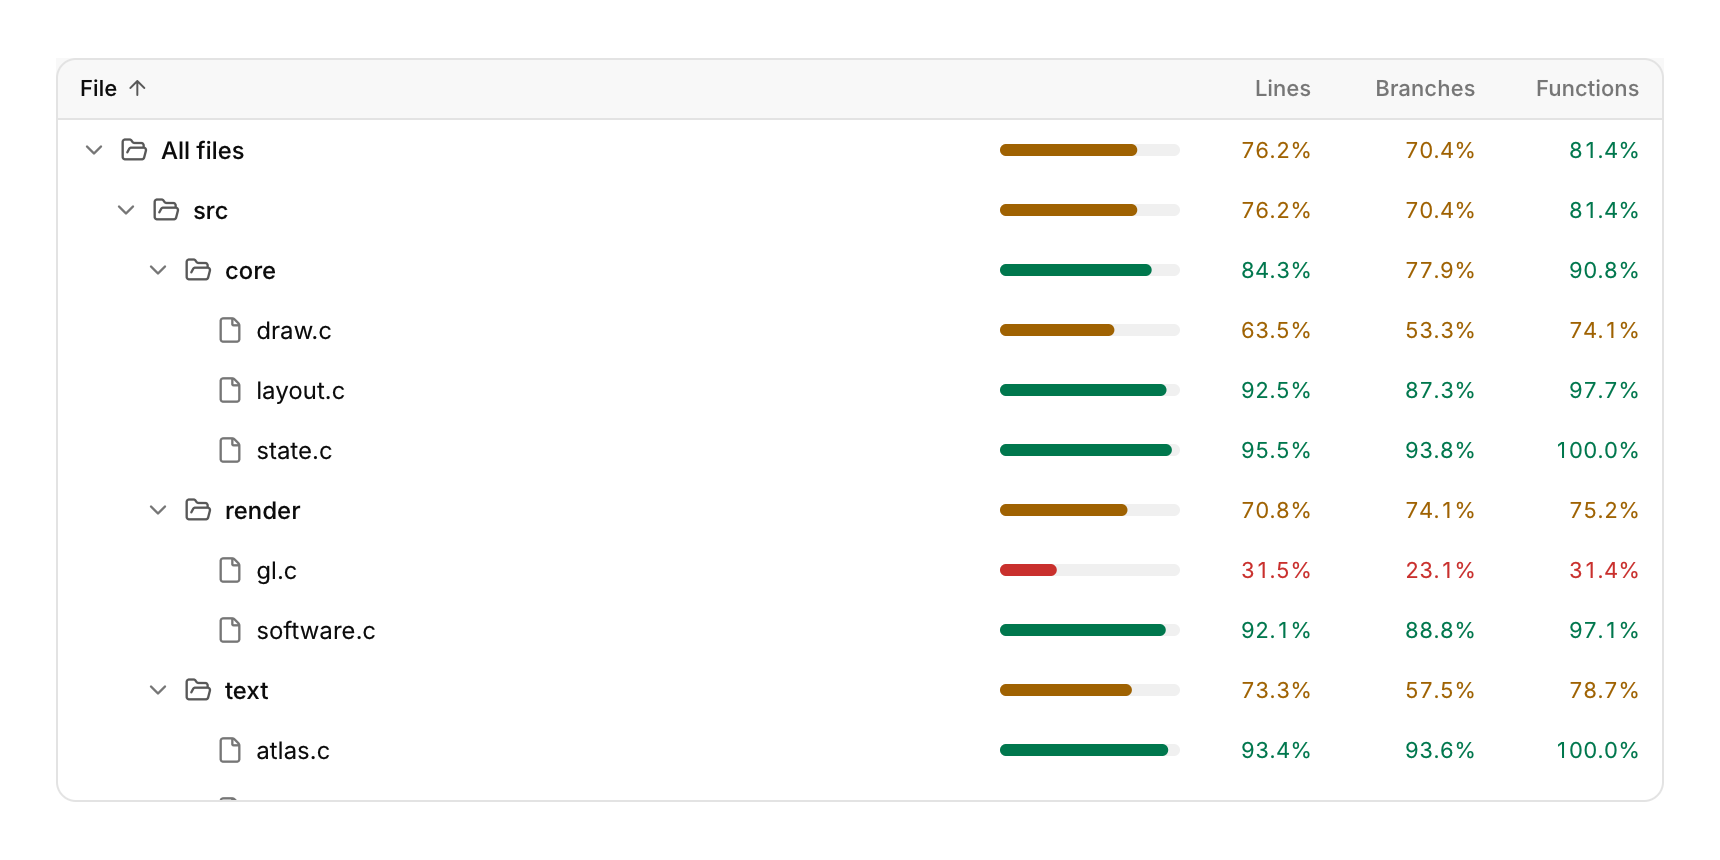
Test coverage as a tree built from the files' paths.
Functions: cui_coverage
Usage
static const cui_coverage_file files[] = {
    { "src/core/layout.c", 1840, 1702, 620, 541, 88, 86 },   /* lines, hit; branches, hit; functions, hit */
    { "src/render/gl.c", 1300, 410, 260, 60, 70, 22 },
};
cui_coverage_result r = cui_coverage(ui, "coverage", files, 2);
if (r.activated >= 0) open_file(files[r.activated].path);
Each folder sums up what it holds, and a row for all files sits on top. Lines show as a bar and a percentage, with branches and functions beside them. They are colored red below low (50%), amber below high (80%) and green above. A click on a column's title sorts by it, and a second click reverses the order; folders stay above files. A click on a folder folds it. Up and Down move the selection, Left and Right fold and unfold a folder, and Enter folds a folder or, on a file, reports activated, as a double click does. A hover shows the counts behind the percentages. On a phone only the lines column is shown.
Keyboard
- Up and Down move the selection, Left and Right fold and unfold a folder, and Enter folds a folder or, on a file, reports
activated, as a double click does.
Options of cui_coverage
| Option | Type | Default | Description |
|---|---|---|---|
.width | cui_size | Width: CUI_FILL, CUI_FIT, CUI_PX(n) or CUI_PCT(n); unset uses the component's own. | |
.height | float | Height in points; 0 uses the component's own. | |
.low | float | 50 and 80 | percent; default 50 and 80 |
.high | float | 50 and 80 | percent; default 50 and 80 |
cui_coverage_file
| Field | Type | Description |
|---|---|---|
path | const char * | "src/core/layout.c" |
lines | int | lines that can be covered |
lines_hit | int | lines the tests ran |
branches | int | 0 branches: not measured |
branches_hit | int | 0 branches: not measured |
functions | int | functions in the file |
functions_hit | int | functions the tests called |
cui_coverage_result
| Field | Type | Description |
|---|---|---|
activated | int | file opened this frame (Enter or a double-click), or -1 |
lines | float | percent of all lines covered |
Related
- Blame: Source with who last changed each line.
- Time histogram: Event counts over time, stacked by series, as above a log search, with a legend that shows each series' total.
- Feature flags: Flags against environments, edited in place.
- Uptime bars: A status page: each service's current state and a bar for each day of its history.