Components / Data display
Curve editor
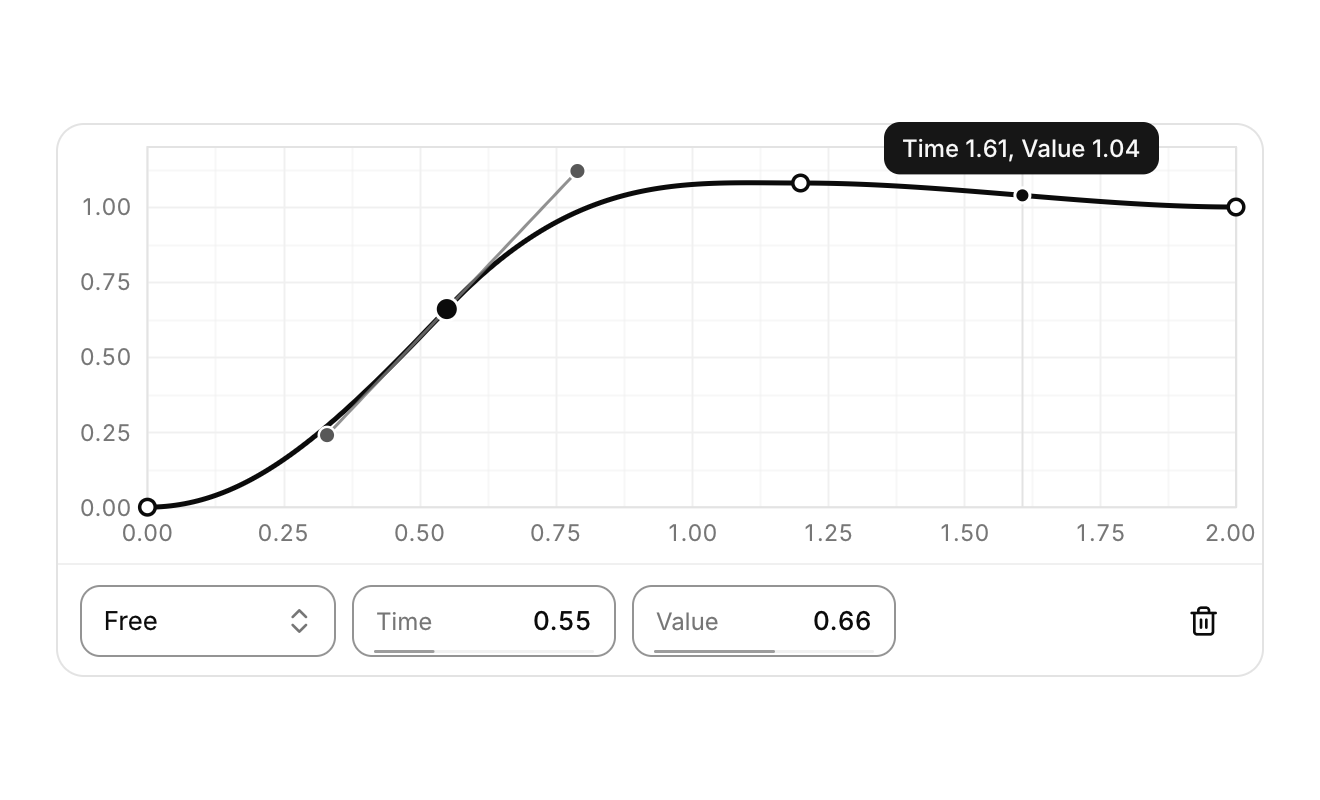
Keyframes on a plot, for easing, animation timing and response curves.
Functions: cui_curve_editor, cui_curve_eval
Usage
static cui_curve_key ease[16] = {
    { 0.0f, 0.0f },                                                  /* zeroed fields: CUI_CURVE_SMOOTH */
    { 0.55f, 0.66f, -0.22f, -0.42f, 0.24f, 0.46f, CUI_CURVE_FREE },  /* x, y, in handle, out handle, mode */
    { 1.2f, 1.08f },
    { 2.0f, 1.0f },
};
static int count = 4, selected = -1;
cui_curve_result r = cui_curve_editor(ui, "ease", ease, &count, 16, .x_max = 2, .y_max = 1.2f,
                                      .x_label = "Time", .y_label = "Value", .selected = &selected,
                                      .show_playhead = playing, .playhead = t);
if (r.added >= 0) insert_track_data(r.added);     /* keys you mirror elsewhere follow along */
if (r.removed >= 0) remove_track_data(r.removed);

/* at runtime: the same curve the editor draws */
float y = cui_curve_eval(ease, count, t);
You own the array of cui_curve_key (kept sorted by x) and its capacity; the editor edits it in place, moving keys, setting handles and modes, inserting and removing keys, and the result says what changed this frame (added and removed are indices, or -1) so data you keep beside each key can follow. Pass .selected to keep the selection yourself. The plot shows the range you give (x_min to x_max, y_min to y_max, 0 to 1 by default) on a quiet grid with labels that thin out on a narrow plot; leave room above or below the keys for curves that overshoot.
A key's mode shapes the segment that leaves it. CUI_CURVE_SMOOTH computes the tangents (they never overshoot the keys, and they are flat at the ends and at peaks), CUI_CURVE_FREE uses the key's own handles (relative to the key in curve units, in_dx at most 0 and out_dx at least 0, shortened to the neighbouring key so the curve never folds back), CUI_CURVE_LINEAR runs straight to the next key and CUI_CURVE_STEP holds its value until the next key. Before the first key the curve keeps the first value, after the last key the last value. cui_curve_eval is the math the editor draws with, so the value an app reads at runtime is the one on screen.
Drag a key to move it: x stays between its neighbours and both coordinates stay inside the range. The selected key shows its handles; dragging one turns a smooth key into a free one with the tangent it had. Hold Shift (or set .snap) to snap a drag to the grid. Double click empty space to add a key, placed on the curve when the click is near it; Delete or Backspace removes the selected key, never leaving fewer than two. Hovering the plot shows the value under the pointer in a tooltip, and hovering a key shows its coordinates. Keys are focusable: Tab moves through them, the arrows nudge the focused key by a hundredth of the range (Shift for a thousandth). The row under the plot sets the selected key's mode and its exact position, and removes it; on a narrow editor its fields stack instead of cutting their labels. .show_playhead draws a marker at .playhead with the curve's value there.
Keyboard
- Hold Shift (or set
.snap) to snap a drag to the grid. - Double click empty space to add a key, placed on the curve when the click is near it; Delete or Backspace removes the selected key, never leaving fewer than two.
- Keys are focusable: Tab moves through them, the arrows nudge the focused key by a hundredth of the range (Shift for a thousandth).
Options of cui_curve_editor
| Option | Type | Default | Description |
|---|---|---|---|
.x_min | float | plotted range; both 0 = 0..1. Keys stay inside it | |
.x_max | float | plotted range; both 0 = 0..1. Keys stay inside it | |
.y_min | float | both 0 = 0..1; leave room above and below for overshoot | |
.y_max | float | both 0 = 0..1; leave room above and below for overshoot | |
.width | cui_size | fill | default fill |
.height | float | 220 | plot height, default 220 |
.x_format | const char * | from the grid step | printf formats for labels and readouts, default from the grid step |
.y_format | const char * | from the grid step | printf formats for labels and readouts, default from the grid step |
.x_label | const char * | "X" and "Y" (e.g. "Time", "Value") | readout names, default "X" and "Y" (e.g. "Time", "Value") |
.y_label | const char * | "X" and "Y" (e.g. "Time", "Value") | readout names, default "X" and "Y" (e.g. "Time", "Value") |
.selected | int * | the selected key or -1, kept by you; NULL keeps it in the editor | |
.snap | bool | drags always snap to the grid (otherwise hold Shift) | |
.show_playhead | bool | a marker at x = playhead | |
.playhead | float | x of the playhead marker, drawn when show_playhead is set |
cui_curve_key
| Field | Type | Description |
|---|---|---|
x | float | position along the horizontal axis, in curve units (seconds in a timeline track) |
y | float | the curve's value at the key |
in_dx | float | handle toward the previous key, relative to the key (FREE) |
in_dy | float | handle toward the previous key, relative to the key (FREE) |
out_dx | float | handle toward the next key, relative to the key (FREE) |
out_dy | float | handle toward the next key, relative to the key (FREE) |
mode | uint8_t | cui_curve_mode |
cui_curve_result
| Field | Type | Description |
|---|---|---|
changed | bool | a key moved, a handle or mode changed, or a key was added or removed |
added | int | index of the key added this frame, or -1 |
removed | int | index the removed key had, or -1 |
selected | int | the selected key, or -1 |
hovered | bool | the pointer is over the plot: |
hover_x | float | the x under it and the curve's value there |
hover_y | float | the x under it and the curve's value there |
Related
- Gradient editor: A color ramp with its stops underneath, over a checkerboard so transparent stops read as transparent.
- Flame graph: A profiler timeline: time runs left to right and call depth top to bottom, so each span sits in the row of its depth, under its parent.
- Timeline editor: A dope sheet for animation, video and audio tools: tracks, a time ruler and keys you can move.
- Hex viewer: The bytes of a file or of memory in hex and ASCII, for binary tools, emulators and debuggers.