Components / Charts
Scatter and bubble
Points on two axes, with an optional third value as the size of each bubble.
Functions: cui_scatter_chart
Usage
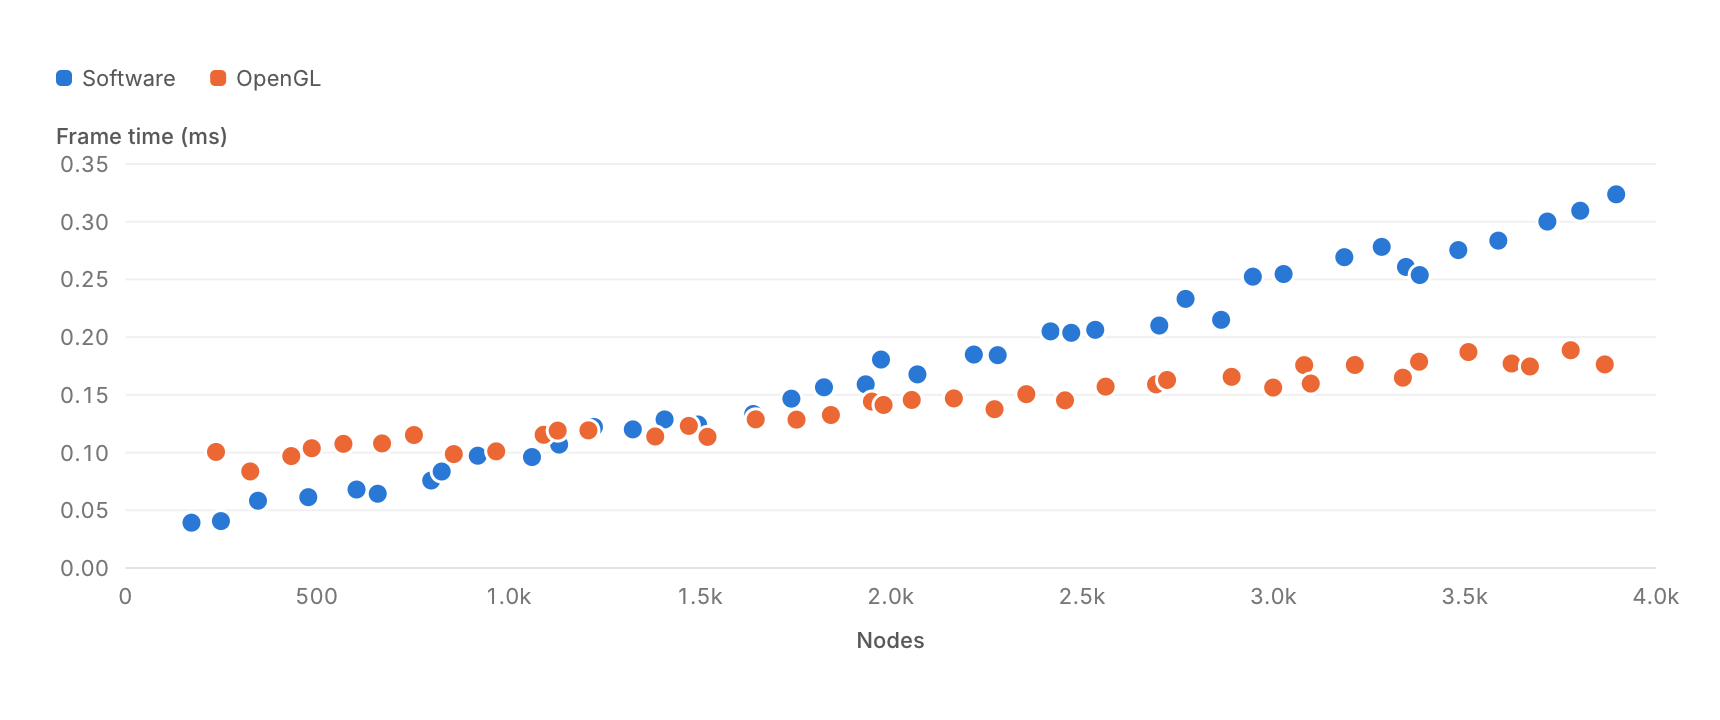
cui_scatter_series s[] = { { "Software", points_a, sizes_a, 40 }, { "OpenGL", points_b, sizes_b, 40 } };
cui_scatter_chart(ui, "frames", s, 2, .height = 300, .x_label = "Nodes", .y_label = "Frame time (ms)", .y_format = "%.2f");
Leave sizes NULL for a scatter. With sizes, the area of a bubble follows its value. Every mark has a 1.5 point ring in the surface color, so overlapping points stay apart, and the nearest point under the pointer gets guide lines to both axes.
Options of cui_scatter_chart
| Option | Type | Default | Description |
|---|---|---|---|
.width | cui_size | Width: CUI_FILL, CUI_FIT, CUI_PX(n) or CUI_PCT(n); unset uses the component's own. | |
.height | float | Height in points; 0 uses the component's own. | |
.x_label | const char * | title under the x axis; also names the x value in the tooltip | |
.y_label | const char * | title above the y axis; also names the y value in the tooltip | |
.x_format | const char * | printf format for the x axis labels and the tooltip | |
.y_format | const char * | printf format for the y axis labels and the tooltip | |
.no_legend | bool | Hides the legend. |
cui_scatter_series
| Field | Type | Description |
|---|---|---|
name | const char * | shown in the legend, which appears with two or more series |
points | const cui_vec2 * | the points, x and y in data units |
sizes | const float * | optional, one per point: makes a bubble chart, each bubble sized against the largest |
count | int | number of points (and of sizes) |
color | cui_color | A theme color such as CUI_COLOR_ACCENT, or CUI_RGB(0x7747ff); unset uses the theme's. |
Related
- Radial gauge: One value on a dial, for dashboards: speed, load, temperature, a score against a goal.
- Bar list and activity rings: A ranked list with a bar behind each row, and concentric rings that fill toward a goal.
- Candlestick chart: Open, high, low and close per period, for prices.
- Sankey: Flows between stages, drawn as ribbons whose width follows the amount.