Components / Charts
Candlestick chart
Open, high, low and close per period, for prices.
Functions: cui_candlestick
Usage
static cui_candle candles[MAX];            /* open, high, low, close, volume per period */
static const char *dates[MAX];
static float sma[MAX];                     /* NaN where the average has no value yet */
cui_series avg = { "SMA 20", sma, count, { 0 } };

int at = cui_candlestick(ui, "nrth", candles, count, .labels = dates, .overlays = &avg, .overlay_count = 1);
if (at >= 0) show_period(at);
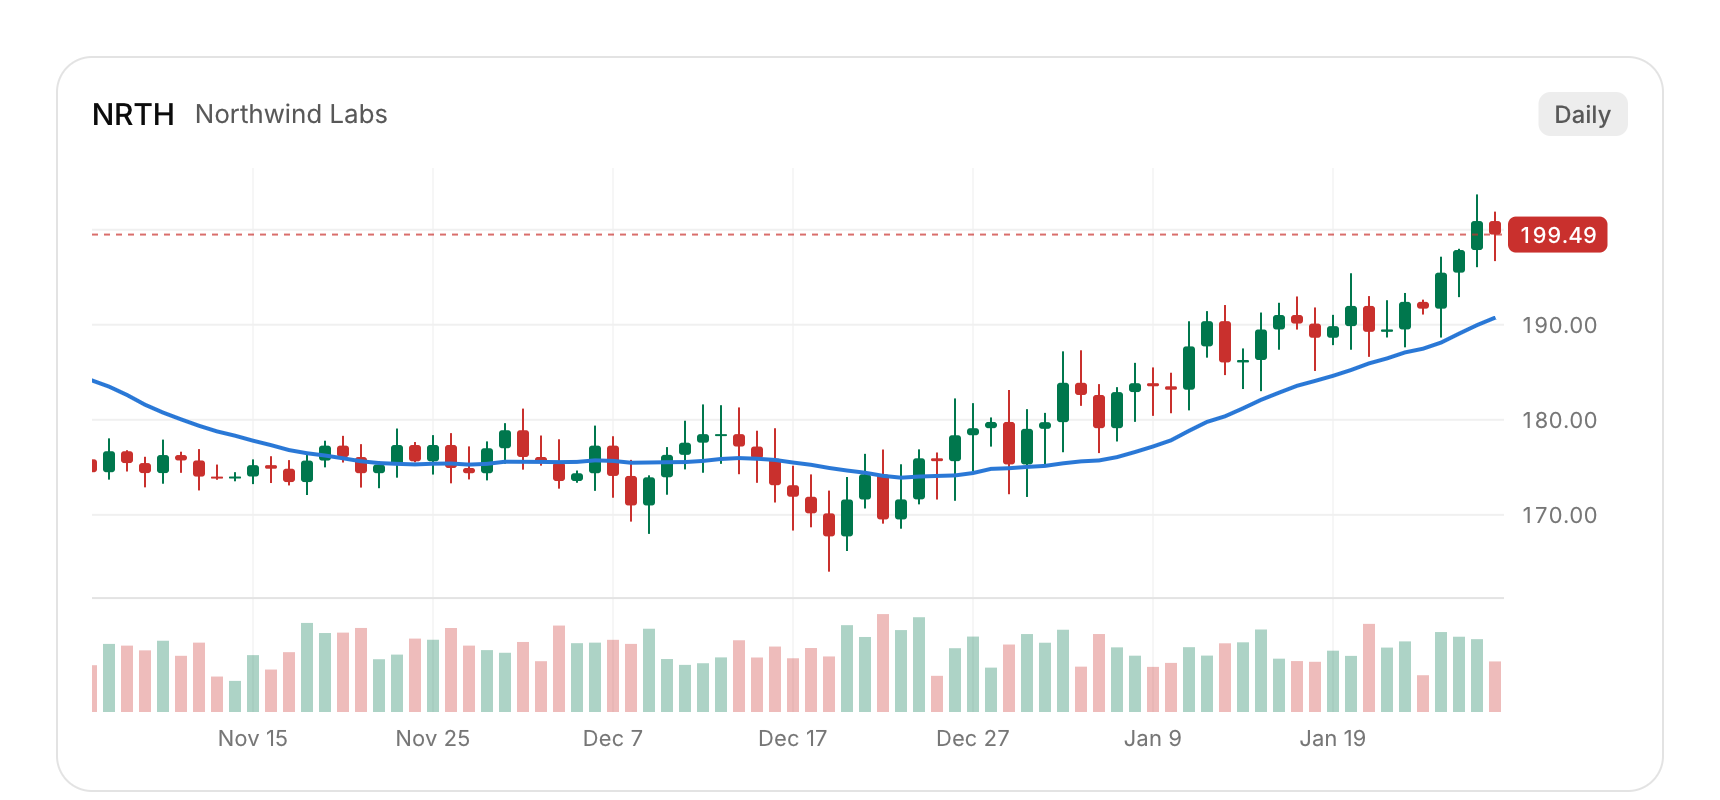
Candles that close higher are drawn in the success color and the rest in the danger color (up and down change them); ohlc draws OHLC bars instead of bodies. Volume bars sit in their own band under the prices whenever any candle has volume (no_volume hides them), overlays adds lines with one value per candle, such as moving averages, and a dashed line tags the last close on the price axis. The price axis is on the right and fits the candles in view as you pan, easing between ranges. Time labels come from labels, thinned to a spacing that reads.
The wheel zooms around the pointer and dragging (or Shift+wheel, or a sideways scroll) pans. Hovering shows a crosshair with the price at the pointer and a tooltip with the candle's open, high, low, close, change from the previous close and volume; the call returns that candle. With the chart focused, Left and Right move the crosshair (Shift+Left and Shift+Right by ten), Home and End jump to the first and last candle, + and - zoom and 0 fits everything. While the newest candle is in view the chart follows new ones as you append them; pan back in time and it stays where you left it.
You own the candles; only the ones in view are read each frame. When zooming out leaves fewer than about three points per candle, candles merge into one bar per pixel column (the first open, the highest high, the lowest low, the last close and the summed volume), so 100,000 candles zoomed all the way out build in about a millisecond.
Keyboard
- The wheel zooms around the pointer and dragging (or Shift+wheel, or a sideways scroll) pans.
- With the chart focused, Left and Right move the crosshair (Shift+Left and Shift+Right by ten), Home and End jump to the first and last candle, + and - zoom and 0 fits everything.
Options of cui_candlestick
| Option | Type | Default | Description |
|---|---|---|---|
.width | cui_size | Width: CUI_FILL, CUI_FIT, CUI_PX(n) or CUI_PCT(n); unset uses the component's own. | |
.height | float | 320 | default 320 |
.labels | const char *const * | one per candle (dates or times): the time axis and the tooltip | |
.format | const char * | "%.2f" | prices, default "%.2f" |
.overlays | const cui_series * | series drawn as lines over the candles; at most 4 | |
.overlay_count | int | entries in overlays: lines with one value per candle, e.g. moving averages | |
.no_volume | bool | volume bars show when any candle has volume | |
.ohlc | bool | OHLC bars instead of candle bodies | |
.up | cui_color | the success and danger colors | default the success and danger colors |
.down | cui_color | the success and danger colors | default the success and danger colors |
cui_candle
| Field | Type | Description |
|---|---|---|
open | float | price at the start of the period |
high | float | highest price in the period |
low | float | lowest price in the period |
close | float | price at the end of the period |
volume | float | amount traded in the period, drawn as a bar under the candle; 0 for none |
Related
- Radial gauge: One value on a dial, for dashboards: speed, load, temperature, a score against a goal.
- Scatter and bubble: Points on two axes, with an optional third value as the size of each bubble.
- Bar list and activity rings: A ranked list with a bar behind each row, and concentric rings that fill toward a goal.
- Sankey: Flows between stages, drawn as ribbons whose width follows the amount.