Components / Charts
Radial gauge
One value on a dial, for dashboards: speed, load, temperature, a score against a goal.
Functions: cui_radial_gauge
Usage
static const cui_gauge_band load[] = { { 60, CUI_TONE_SUCCESS }, { 85, CUI_TONE_WARNING }, { 100, CUI_TONE_DANGER } };

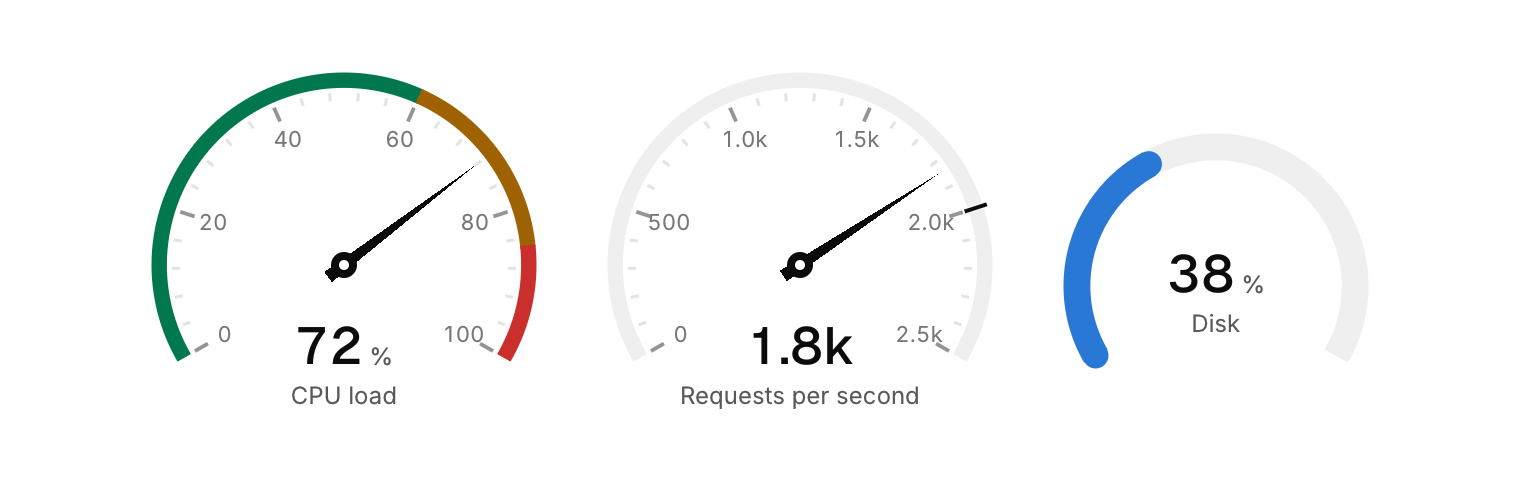
cui_radial_gauge(ui, "cpu", cpu_load, 0, 100, .unit = "%", .label = "CPU load", .bands = load, .band_count = 3);
cui_radial_gauge(ui, "rps", rps, 0, 2500, .label = "Requests per second", .show_target = true, .target = 2000);
cui_radial_gauge(ui, "disk", disk_used, 0, 100, .unit = "%", .label = "Disk", .no_needle = true, .ticks = -1);
The arc sweeps 240 degrees (sweep, 90 to 300) between min and max, with labelled major ticks (ticks divisions, 5 by default, -1 for none) and four minor ticks between them. bands color stretches of the arc in the theme's tones, each running from the band before it (or min) up to its to. A needle points at the value and springs there with a little overshoot when the value changes (it snaps with reduced motion); no_needle fills a thick arc instead and puts the readout in the middle, in the color of the band the value is in. show_target adds a marker at target. The readout uses format (by default whole numbers, with large ones shortened to 1.8k) and unit, with label under it. size sets the width and the height follows the sweep.
Options of cui_radial_gauge
| Option | Type | Default | Description |
|---|---|---|---|
.label | const char * | under the value | |
.format | const char * | "%.0f" | the value and the tick labels, default "%.0f" |
.unit | const char * | after the value, smaller | |
.size | float | 200 | width, default 200; the height follows the sweep |
.sweep | float | 240 (90 to 300) | degrees of arc, default 240 (90 to 300) |
.bands | const cui_gauge_band * | colored stretches of the arc, each from the one before up to its to; at most 16 | |
.band_count | int | number of bands | |
.ticks | int | 5 | labelled divisions, default 5; -1 hides the ticks |
.target | float | a marker on the arc, when show_target is set | |
.show_target | bool | draws the marker at target | |
.no_needle | bool | a thick arc filled to the value instead of a needle |
Related
- Candlestick chart: Open, high, low and close per period, for prices.
- Scatter and bubble: Points on two axes, with an optional third value as the size of each bubble.
- Bar list and activity rings: A ranked list with a bar behind each row, and concentric rings that fill toward a goal.
- Sankey: Flows between stages, drawn as ribbons whose width follows the amount.