Components / Charts
Heatmap
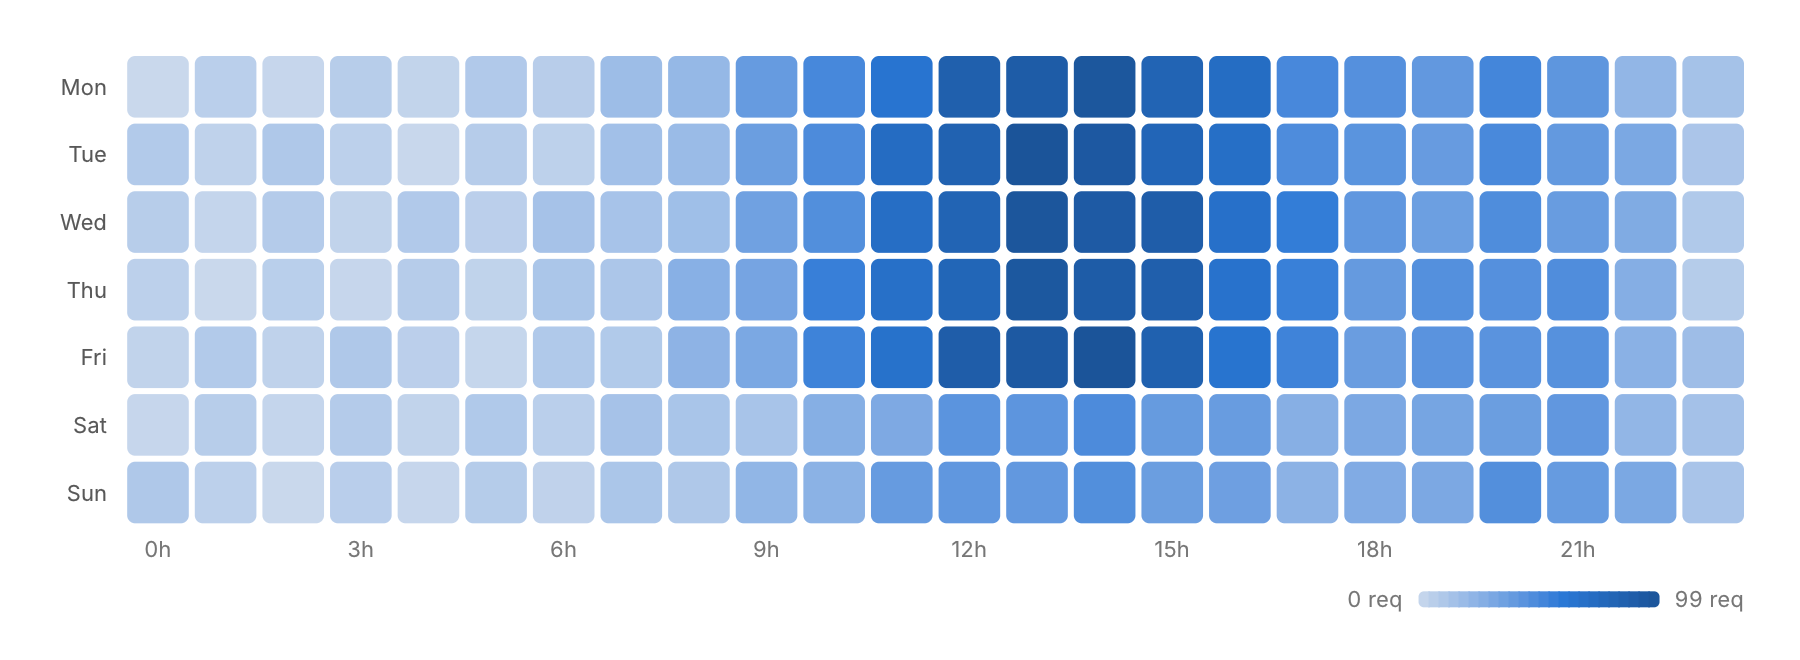
A grid of cells colored by value, for one category against another.
Functions: cui_heatmap
Usage
float traffic[7 * 24];   /* values[row * cols + col] */
cui_heatmap(ui, "traffic", traffic, 7, 24, .row_labels = weekdays, .col_labels = hours, .format = "%.0f req");
One hue, light to dark (dim to bright in dark mode), with a scale below. Column labels skip themselves when they would collide; pass NULL for the ones you do not want. min and max fix the range; cell fixes the size, otherwise the cells fit the width.
Options of cui_heatmap
| Option | Type | Default | Description |
|---|---|---|---|
.row_labels | const char *const * | one label per row, left of the grid; NULL for none | |
.col_labels | const char *const * | one label per column, under the grid; labels that would overlap are skipped | |
.cell | float | fits the width | cell size, default fits the width |
.min | float | the data's | value range, default the data's |
.max | float | the data's | value range, default the data's |
.color | cui_color | the accent | hue of the scale, default the accent |
.format | const char * | A printf format for the values, such as "%.0f ms". | |
.width | cui_size | Width: CUI_FILL, CUI_FIT, CUI_PX(n) or CUI_PCT(n); unset uses the component's own. |
Related
- Calendar heatmap: A year of days as small squares colored by activity.
- Charts: Line, bar and donut charts and sparklines, with axes, a crosshair and a tooltip on hover.
- Treemap and radar: A treemap shows the parts of a whole as rectangles sized by value. A radar chart compares items across several axes.
- Funnel, split bar and waffle: Three charts for shares: a funnel for the steps of a conversion, a single bar split into parts, and a waffle of 100 squares.