Components / Charts
Charts
Line, bar and donut charts and sparklines, with axes, a crosshair and a tooltip on hover.
Functions: cui_bar_chart, cui_donut_chart, cui_line_chart, cui_sparkline
Usage
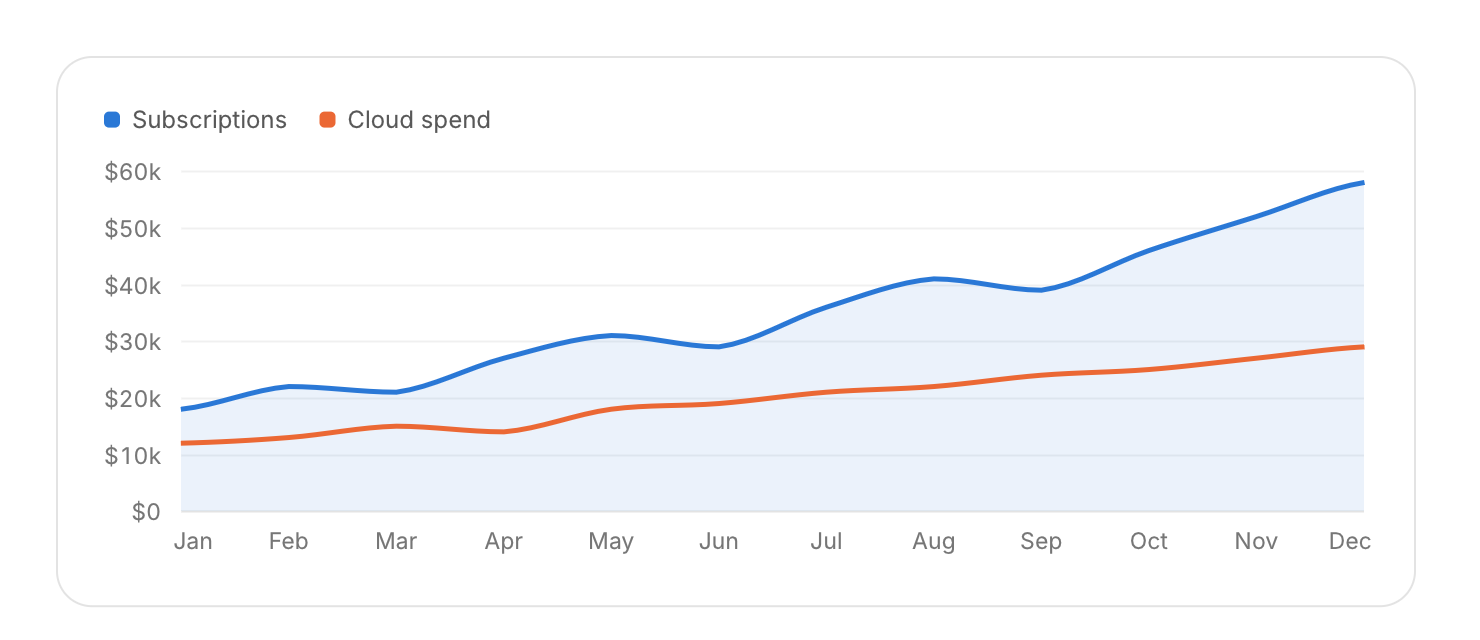
cui_series s[] = { { "Subscriptions", subs, 12 }, { "Cloud spend", cloud, 12 } };
cui_line_chart(ui, "revenue", s, 2, .labels = months, .label_count = 12, .area = true, .smooth = true, .format = "$%.0fk");
cui_bar_chart(ui, "visits", s, 2, .labels = months, .label_count = 6);
cui_bar_chart(ui, "runs", runs, 3, .labels = weeks, .label_count = 8, .stacked = true);   /* passed, retried, failed */
cui_donut_chart(ui, "share", values, labels, 4, .format = "%.0f%%");
cui_sparkline(ui, values, 12, CUI_PX(120), 32, CUI_COLOR_SERIES(0));
Charts draw in once, pick nice axis ticks, show a crosshair that glides between points and a tooltip with every series on hover. Colors come from the theme's series palette, which starts at the accent hue. With area and several series, only the first is filled, so fills never tint each other into a third color.
Options of cui_bar_chart, cui_donut_chart, cui_line_chart
| Option | Type | Default | Description |
|---|---|---|---|
.width | cui_size | Width: CUI_FILL, CUI_FIT, CUI_PX(n) or CUI_PCT(n); unset uses the component's own. | |
.height | float | 220 | default 220 |
.labels | const char *const * | x axis labels | |
.label_count | int | number of labels; 0 means one per data point | |
.area | bool | fill under lines | |
.no_grid | bool | Hides the grid lines. | |
.no_legend | bool | Hides the legend. | |
.stacked | bool | bar chart | |
.smooth | bool | curved lines | |
.format | const char * | "%.0f" | value format for axis and tooltip, default "%.0f" |
.min | float | fixed y range when min != max | |
.max | float | fixed y range when min != max |
cui_series
| Field | Type | Description |
|---|---|---|
name | const char * | shown in the legend and in the hover tooltip |
values | const float * | the series' data, one value per point |
count | int | number of values |
color | cui_color | default: series palette |
Related
- Heatmap: A grid of cells colored by value, for one category against another.
- Calendar heatmap: A year of days as small squares colored by activity.
- Treemap and radar: A treemap shows the parts of a whole as rectangles sized by value. A radar chart compares items across several axes.
- Funnel, split bar and waffle: Three charts for shares: a funnel for the steps of a conversion, a single bar split into parts, and a waffle of 100 squares.