Components / Charts
Funnel, split bar and waffle
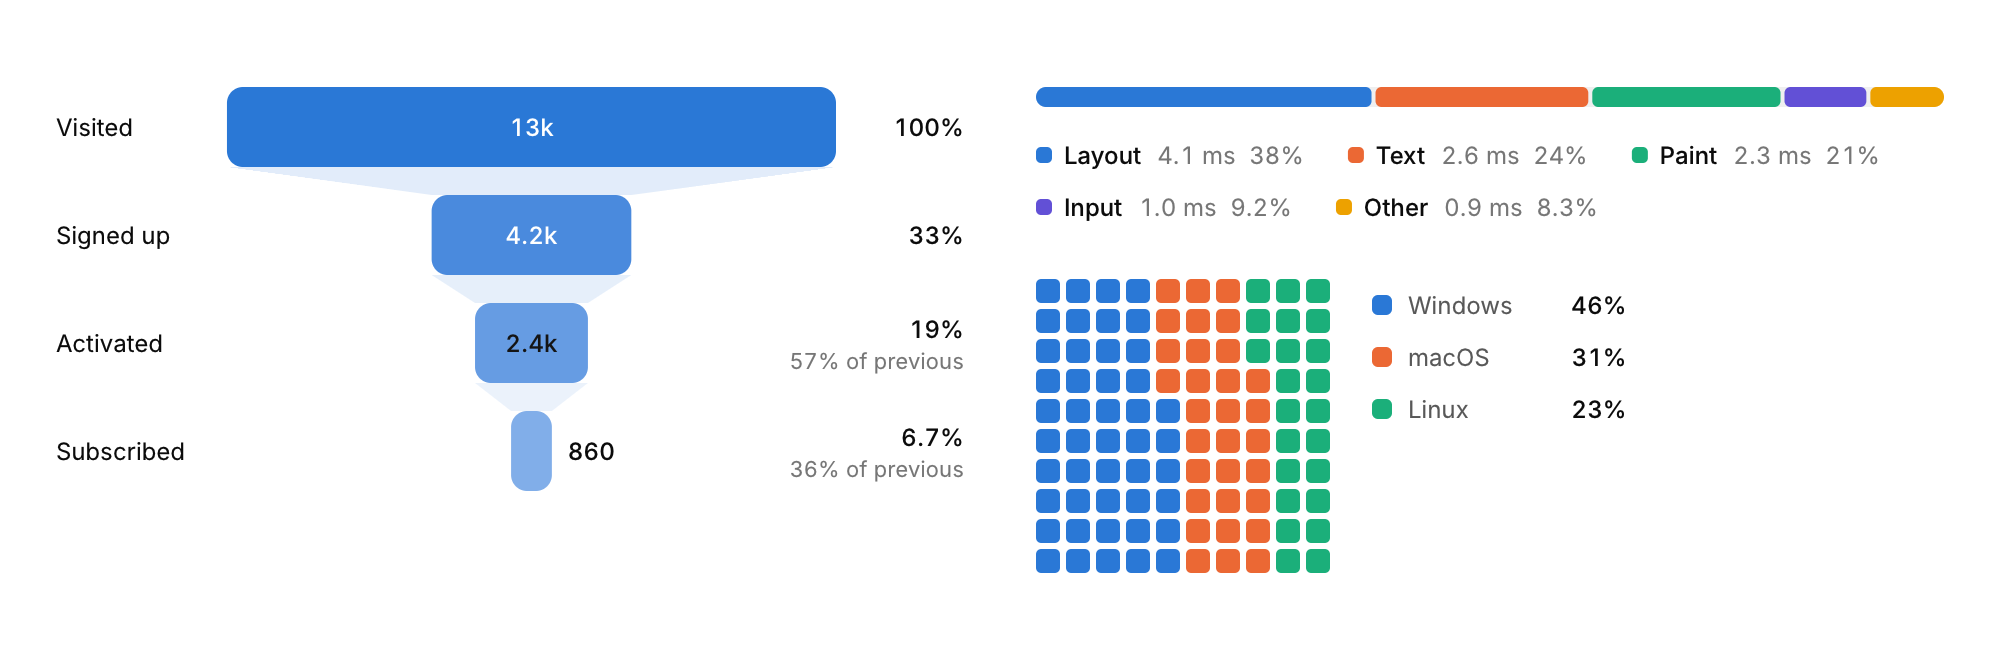
Three charts for shares: a funnel for the steps of a conversion, a single bar split into parts, and a waffle of 100 squares.
Functions: cui_funnel, cui_split_bar, cui_waffle
Usage
static const cui_viz_item stages[] = { { "Visited", 12840 }, { "Signed up", 4210 }, { "Activated", 2380 }, { "Subscribed", 860 } };
cui_funnel(ui, "signup", stages, 4);
cui_split_bar(ui, "frame", parts, 5, .format = "%.0f ms");
cui_waffle(ui, "installs", platforms, 3, .cell = 12);
The funnel shows each stage's share of the first and, under it, the conversion from the stage before. The split bar is one bar cut into parts with 2 point gaps and a legend of values and shares. The waffle hands out its 100 squares by largest remainder, so the counts always add up. Hovering a part, a square or a legend row picks that item out.
Options of cui_funnel
| Option | Type | Default | Description |
|---|---|---|---|
.width | cui_size | Width: CUI_FILL, CUI_FIT, CUI_PX(n) or CUI_PCT(n); unset uses the component's own. | |
.height | float | Height in points; 0 uses the component's own. | |
.format | const char * | A printf format for the values, such as "%.0f ms". | |
.color | cui_color | A theme color such as CUI_COLOR_ACCENT, or CUI_RGB(0x7747ff); unset uses the theme's. |
Options of cui_split_bar
| Option | Type | Default | Description |
|---|---|---|---|
.width | cui_size | Width: CUI_FILL, CUI_FIT, CUI_PX(n) or CUI_PCT(n); unset uses the component's own. | |
.height | float | Height in points; 0 uses the component's own. | |
.format | const char * | A printf format for the values, such as "%.0f ms". | |
.no_legend | bool | Hides the legend. |
Options of cui_waffle
| Option | Type | Default | Description |
|---|---|---|---|
.cell | float | 18 | size of a square in points, default 18 |
.columns | int | 10 | squares per row, at most 60; default 10 |
.rows | int | 10 | rows of squares, at most 60; default 10 |
.format | const char * | A printf format for the values, such as "%.0f ms". |
cui_viz_item
| Field | Type | Description |
|---|---|---|
label | const char * | A label shown above or beside the control. |
value | float | the item's amount: its area, length or share, by chart (activity rings: 1 is a full turn) |
color | cui_color | A theme color such as CUI_COLOR_ACCENT, or CUI_RGB(0x7747ff); unset uses the theme's. |
Related
- Sankey: Flows between stages, drawn as ribbons whose width follows the amount.
- Treemap and radar: A treemap shows the parts of a whole as rectangles sized by value. A radar chart compares items across several axes.
- Bar list and activity rings: A ranked list with a bar behind each row, and concentric rings that fill toward a goal.
- Calendar heatmap: A year of days as small squares colored by activity.