Components / Charts
Calendar heatmap
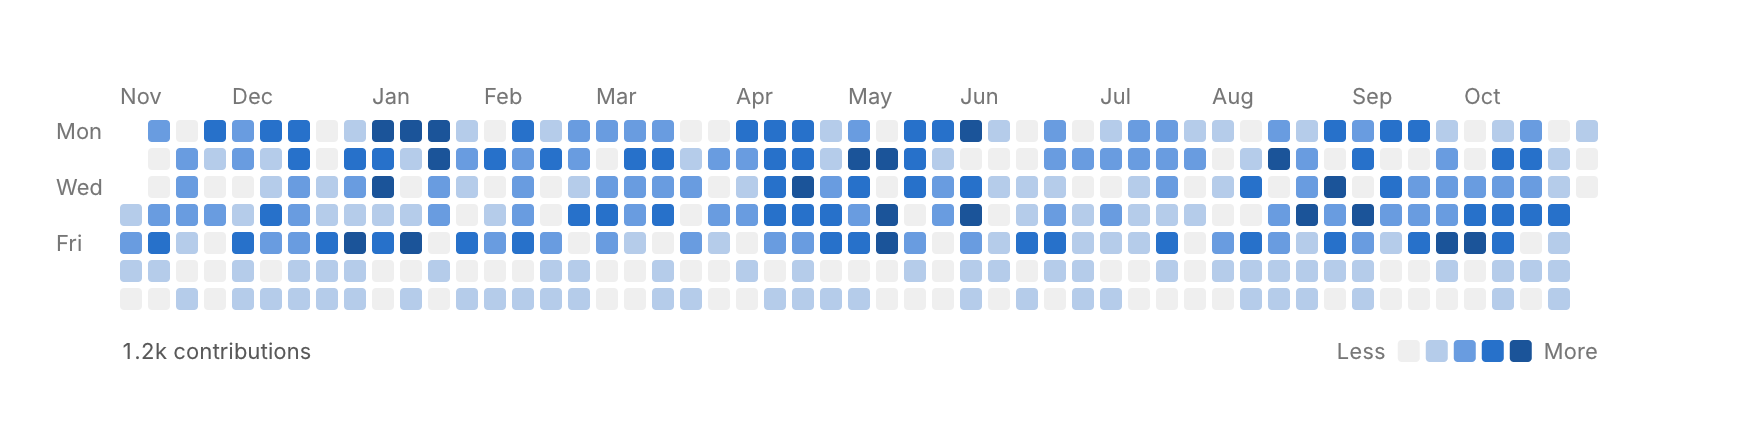
A year of days as small squares colored by activity.
Functions: cui_calendar_heatmap
Usage
static float per_day[364];                   /* one value for each day, counted from start */
cui_date start = { 2025, 11, 11 };           /* year, month, day */
cui_calendar_heatmap(ui, "year", start, per_day, 364, .unit = "contributions");
One square a day in five levels, weeks as columns starting on Monday, month labels where a month begins. The tooltip shows the date and the value; unit also adds a total under the grid.
Returns the index of the day that was clicked, or -1. per_day is your array of days floats, only read. A value of 0 or less leaves the square empty, and the rest fall into four levels by their share of the largest value, so one extreme day dims all the others. In a container too narrow for the whole range, only the most recent weeks that fit are drawn, and the returned index then counts from the first day drawn.
Options of cui_calendar_heatmap
| Option | Type | Default | Description |
|---|---|---|---|
.cell | float | 11 | size of a day's square in points, default 11 |
.color | cui_color | A theme color such as CUI_COLOR_ACCENT, or CUI_RGB(0x7747ff); unset uses the theme's. | |
.format | const char * | A printf format for the values, such as "%.0f ms". | |
.unit | const char * | A unit shown after the value. |
Related
- Treemap and radar: A treemap shows the parts of a whole as rectangles sized by value. A radar chart compares items across several axes.
- Heatmap: A grid of cells colored by value, for one category against another.
- Funnel, split bar and waffle: Three charts for shares: a funnel for the steps of a conversion, a single bar split into parts, and a waffle of 100 squares.
- Charts: Line, bar and donut charts and sparklines, with axes, a crosshair and a tooltip on hover.