Components / Developer tools
Trace viewer
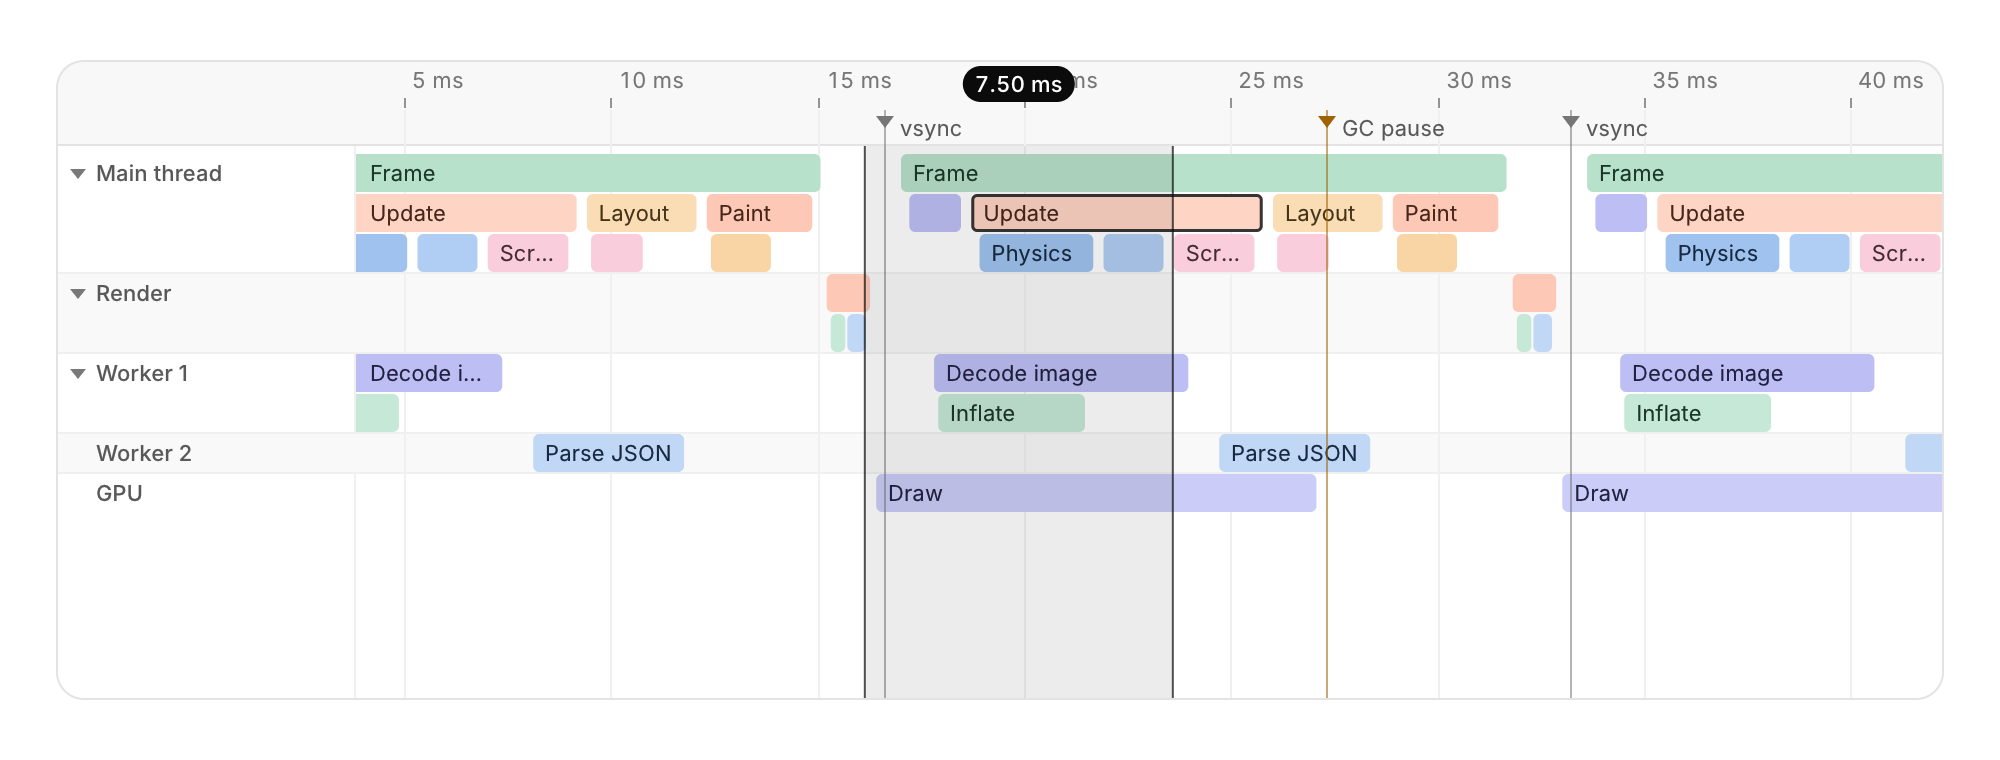
A tracing timeline in the manner of a performance panel.
Functions: cui_trace_sort, cui_trace_view
Usage
static cui_trace_track tracks[] = { { "Main thread" }, { "Render" }, { "Worker 1" } };
static cui_trace_view view;   /* zeroed: fits everything */
static int selected = -1;
cui_trace_sort(spans, span_count);   /* once: by track, depth, then start */
cui_trace_view(ui, "trace", tracks, 3, spans, span_count, &view, &selected,
               .markers = markers, .marker_count = marker_count);
Each thread, process or service has a lane of nested spans, drawn like the flame graph and sharing its colors and ruler. Markers (vsync, a GC pause, a deploy) run across every lane, with their names in a strip under the ruler. The wheel zooms around the pointer, Shift+wheel pans, and over the lane names the wheel scrolls the lanes. Dragging pans, a click selects, and a double click zooms to a span. Shift+drag measures a range, which view.mark_start and mark_end hold and the ruler labels with its length. A click on a lane's name folds it to its top row, and collapsed keeps that in your track array. With the viewer focused, Left and Right step along the row, Up goes to the parent and Down to the first child. + and - zoom, Enter zooms to the selection, F fits, and Esc clears the measurement and then the selection. Only the rows and spans in view are visited, and spans thinner than a point merge into runs, so 200,000 spans take under a millisecond a frame. Below 560 points the lane names get a narrower column.
Keyboard
- The wheel zooms around the pointer, Shift+wheel pans, and over the lane names the wheel scrolls the lanes.
- Shift+drag measures a range, which
view.mark_startandmark_endhold and the ruler labels with its length. - With the viewer focused, Left and Right step along the row, Up goes to the parent and Down to the first child. + and - zoom, Enter zooms to the selection, F fits, and Esc clears the measurement and then the selection.
Options of cui_trace_view
| Option | Type | Default | Description |
|---|---|---|---|
.width | cui_size | Width: CUI_FILL, CUI_FIT, CUI_PX(n) or CUI_PCT(n); unset uses the component's own. | |
.height | float | 320 | default 320 |
.row_height | float | 20 | default 20 |
.markers | const cui_trace_marker * | moments drawn as lines across every lane, named in a strip under the ruler | |
.marker_count | int | number of markers |
cui_trace_span
| Field | Type | Description |
|---|---|---|
name | const char * | drawn in the span when it fits, and in its tooltip |
start | double | when the span begins, in seconds |
end | double | when the span ends, in seconds; end >= start |
track | int | index into the tracks: the lane the span is drawn in |
depth | int | row within the lane, 0 = top; a child lies within its parent |
color_key | uint32_t | picks the color; 0: hashed from the name |
cui_trace_track
| Field | Type | Description |
|---|---|---|
name | const char * | the lane's name, in the column on the left |
collapsed | bool | the lane shows only its top row; a click on its name toggles this |
cui_trace_view
| Field | Type | Description |
|---|---|---|
start | double | visible time range; end <= start fits everything |
end | double | visible time range; end <= start fits everything |
scroll | float | points scrolled down |
mark_start | double | measured range; mark_end <= mark_start: none |
mark_end | double | measured range; mark_end <= mark_start: none |
cui_trace_result
| Field | Type | Description |
|---|---|---|
selection_changed | bool | *selected changed this frame (click or keys) |
view_changed | bool | the visible time range or the scroll in *view changed (zoom, pan, fit) |
hovered | int | span under the pointer, or -1 |
Related
- Flame graph: A profiler timeline: time runs left to right and call depth top to bottom, so each span sits in the row of its depth, under its parent.
- Regex tester: A pattern, its flags and a test text, with every match and group highlighted.
- Network waterfall: HTTP requests as a table with a timing bar each.
- Test explorer: Test results as a tree of suites and tests, each with its status and time.